
Learn how to create, read, and interpret line plots with whole numbers and fractions, including mixed numbers. Understand their parts, choose suitable scales, and use frequency marks to compare values, recognize patterns, avoid common mistakes, and solve Math problems.
What Is a Line Plot?
A line plot is a graph that displays numerical data along a number line. It uses marks, usually Xs, to show how often each value appears in a data set. Values are arranged according to their numerical position, and repeated values are stacked above the same point. This makes it easy to see which values occur most often, how the data is distributed, and how individual values compare.
For example, consider the following data set:
3, 4, 4, 5, 5, 5, 6
A line plot places one X above 3, two Xs above 4, three Xs above 5, and one X above 6. The three marks above 5 show that 5 appears three times in the data set.
A line plot organizes numerical information visually so that patterns, frequencies, and differences are easier to identify. The same structure works with whole numbers, fractions, and mixed numbers. The main difference is how the number line is divided and extended to represent the data.
Understanding the Parts of a Line Plot
A line plot has a few basic parts that work together to represent a data set accurately. Understanding each part makes it easier to construct a line plot and interpret the information it displays.
The Number Line and Its Scale
The horizontal number line provides the structure for a line plot. It shows the numerical values in the data set in their correct order, from least to greatest.
The scale determines how the number line is divided and labeled. It must use equal intervals so that the distance between consecutive values remains consistent.
For example, a whole-number line plot might use a scale of 1, 2, 3, 4, 5, and 6. Each interval represents one unit. A fractional line plot might divide each whole unit into fourths or eighths.
The scale must match the data. If the values include eighths, a number line divided only into fourths will not provide enough positions to represent every value accurately.
The small marks along the number line, called tick marks, identify positions on the scale. The equal spaces between consecutive tick marks represent the scale intervals. Tick marks are different from the X marks placed above the line to represent observations.
Data Marks and Frequency
Each X mark represents one observation in the data set. When a value appears more than once, the marks are stacked vertically above that value.
The number of marks above a value is its frequency.
For example, if a line plot has four Xs above 7, the value 7 occurs four times. The four Xs do not mean the value is 4 or that the data point represents 28. They simply show four separate observations of 7.
The total number of X marks on a line plot should equal the total number of observations in the original data set. This provides a useful way to check whether all the data has been represented.
Titles and Labels
A title tells readers what the line plot represents. Labels identify the values or measurements shown on the number line.
For example, a line plot showing the number of books read might have the title Number of Books Read. A line plot showing object lengths might use a title such as Lengths of Objects in Inches.
Include measurement units whenever the data represents quantities such as length, mass, or time. A scale labeled only with fractions may be unclear if readers do not know whether those fractions represent inches, feet, hours, or another unit.
Clear titles and labels help readers understand the information without needing to refer constantly to the original data.
How to Make a Line Plot with Whole Numbers
Creating a line plot with whole numbers involves organizing the data, choosing a suitable scale, and placing one mark above the number line for each observation. Consider this data set:
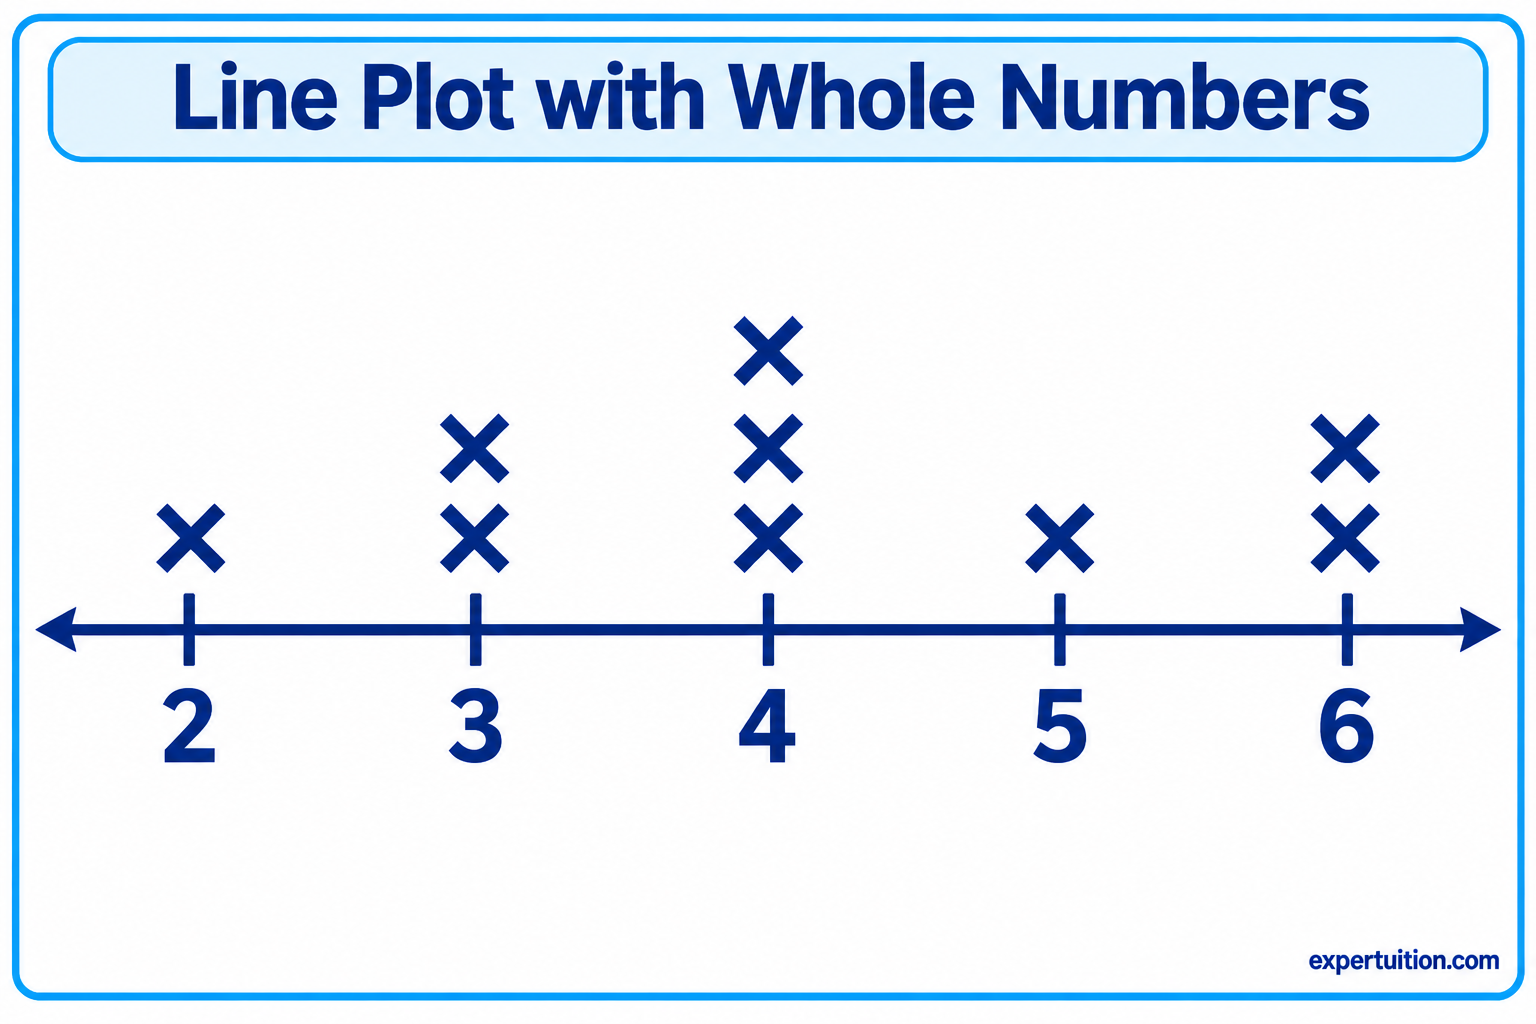
2, 3, 3, 4, 4, 4, 5, 6, 6
The goal is to represent all nine observations accurately.
Organize the Data and Identify Its Range
Begin by arranging the values from least to greatest. This makes it easier to identify the smallest and largest numbers and determine which values repeat.
For the data set:
2, 3, 3, 4, 4, 4, 5, 6, 6
The smallest value is 2, and the largest is 6. The range is the difference between these two values:
6 − 2 = 4
Next, count how many times each number appears.
| Value | Frequency |
|---|---|
| 2 | 1 |
| 3 | 2 |
| 4 | 3 |
| 5 | 1 |
| 6 | 2 |
This frequency table provides a clear record of the observations before plotting them. It also makes it easier to check the completed line plot.
Draw and Label the Number Line
Draw a horizontal line that covers the full range of the data. Since the values extend from 2 to 6, label the number line with 2, 3, 4, 5, and 6.
Use equal spacing between consecutive numbers. Each interval represents one whole number.
Add a descriptive title above the graph. If the data represents a measurement, include the appropriate unit in the title or number-line label.
Plot the Data and Stack Repeated Values
Place one X above the number that corresponds to each observation.
Using the frequency table:
- Place one X above 2.
- Place two Xs above 3.
- Place three Xs above 4.
- Place one X above 5.
- Place two Xs above 6.
Repeated values are stacked vertically rather than placed at separate positions along the number line. This arrangement makes the frequency of each value immediately visible.
Check the Completed Line Plot
Review the line plot to make sure it represents the original data correctly.
Check that:
- The number line covers the smallest and largest values.
- The intervals are equal.
- Every value is positioned above the correct number.
- Repeated values are stacked vertically.
- The total number of X marks is nine, matching the original data set.
Also check that the title and labels clearly describe the data. Compare the marks above each number with the frequency table to confirm that every frequency matches.
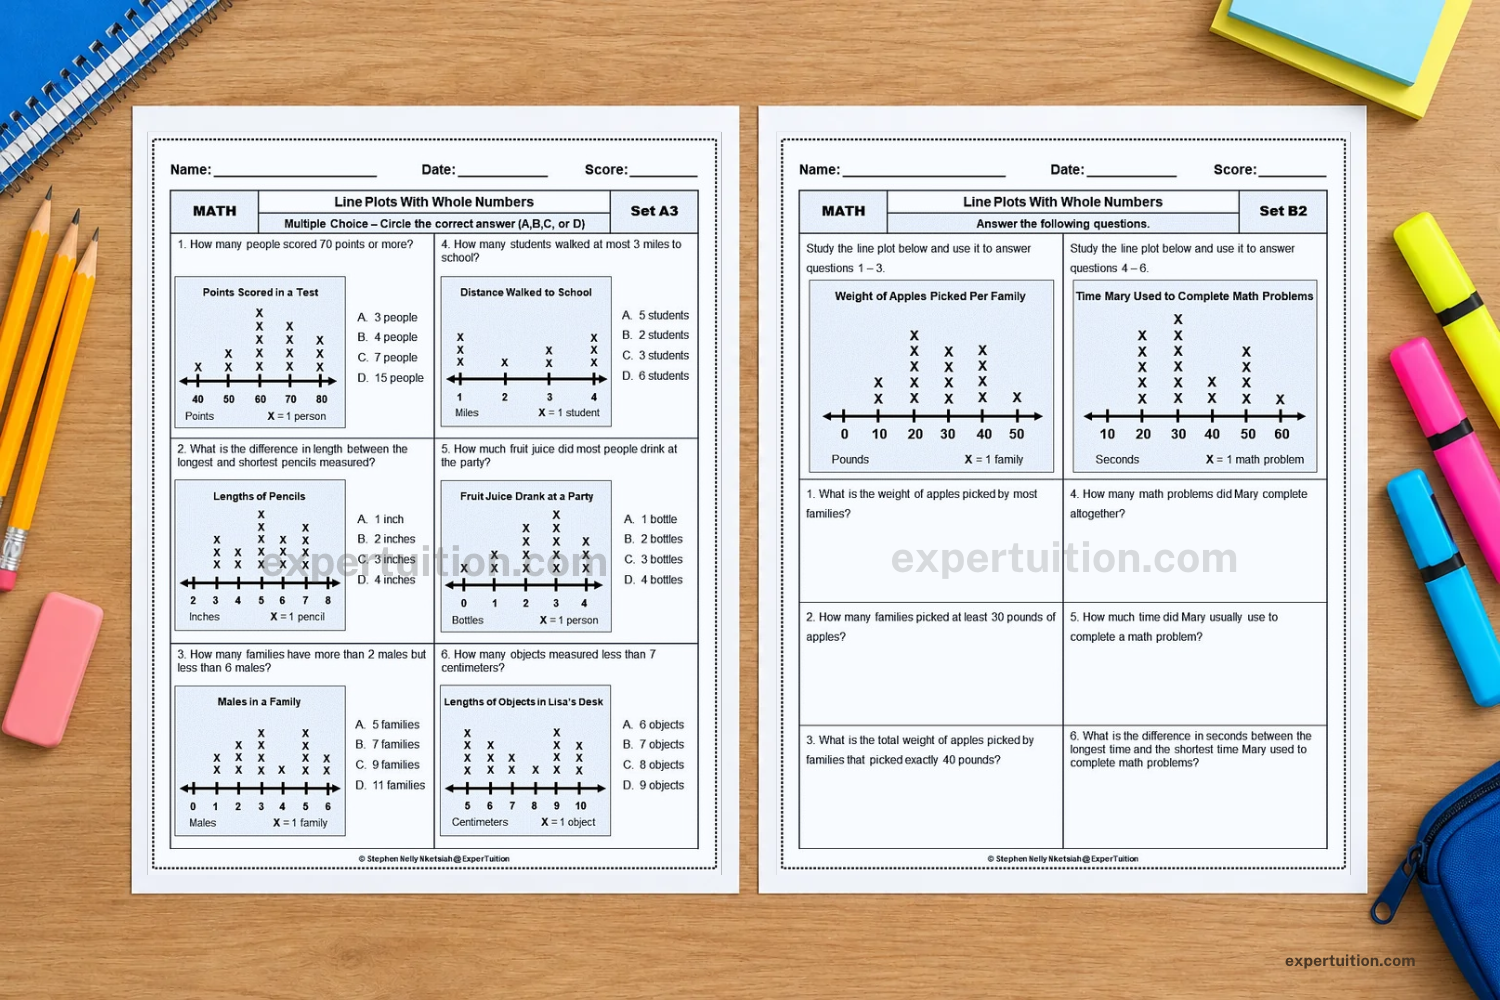
For additional practice with whole-number data, explore the Line Plots with Whole Numbers Worksheets.
Understanding Fractions on a Line Plot
A fractional line plot follows the same basic structure as a whole-number line plot. The difference is that the number line includes fractional positions between whole numbers.
To plot fractions accurately, you need to understand how a number line is divided into equal parts, how fractions relate to one another, and where each fractional value belongs.
Dividing a Number Line into Fractional Intervals
A whole-number interval can be divided into equal parts to represent fractions.
The denominator tells how many equal parts make up one whole. The numerator tells how many of those parts are being counted.
For example:
- Dividing one whole into 2 equal parts creates halves.
- Dividing one whole into 4 equal parts creates fourths.
- Dividing one whole into 8 equal parts creates eighths.
On a number line from 0 to 1, a scale divided into fourths has the positions 0, 1/4, 2/4, 3/4, and 1. A scale divided into eighths has eight equal intervals between 0 and 1.
The intervals must remain equal. When a number line is divided into eighths, the distance from 0 to 1/8 must be the same as the distance from 1/8 to 2/8, and so on.
The scale should be selected according to the values in the data set. If the data includes 1/8, 3/8, and 5/8, dividing the number line into fourths would not provide enough positions to represent those values accurately.
When a data set contains fractions with different denominators, choose a common denominator that allows every value to be represented using equal intervals. The least common denominator often provides a simpler scale. For example, thirds and halves can both be represented in sixths because 1/3 = 2/6 and 1/2 = 3/6.
Locating and Comparing Fractional Values
Fractions are placed according to their numerical size. A fraction closer to zero belongs farther to the left, while a greater fraction belongs farther to the right.
Consider these fractions:
1/4, 3/8, 1/2, 3/4
When placed on a number line from 0 to 1, their order is:
1/4, 3/8, 1/2, 3/4
This order can be understood by expressing the fractions in eighths:
- 1/4 = 2/8
- 3/8 = 3/8
- 1/2 = 4/8
- 3/4 = 6/8
Since all four fractions now have the same denominator, their numerators make their relative positions clear.
When comparing fractions with different denominators, it is useful to think about their positions on the number line or rewrite them as equivalent fractions with a common denominator. Compare the fractions by their values, not simply by looking at their numerators or denominators separately.
Understanding Equivalent Fractions on the Number Line
Equivalent fractions have different numerators and denominators but represent the same value. They occupy the same position on a number line.
For example:
1/2 = 2/4 = 4/8
All three fractions identify the midpoint between 0 and 1. They are different ways of naming the same point, not three separate positions.
Other examples include:
1/4 = 2/8
3/4 = 6/8
This relationship matters when creating fractional line plots. If a data set contains 1/2 and 4/8, both values belong at the same point. They should not be plotted at separate positions simply because they are written differently.
A line plot represents numerical values, not the different fraction names used to describe those values. Equivalent fractions therefore share the same position, and their X marks are stacked together.
Representing Mixed Numbers and Fractions Greater Than One
A fractional line plot is not limited to values between 0 and 1. It can also represent improper fractions and mixed numbers greater than one whole.
For example:
5/4 = 1 1/4
6/4 = 1 1/2
7/4 = 1 3/4
These values belong to positions beyond 1 on the number line. To represent them, extend the number line beyond one whole and continue using the same fractional interval.
If the scale is divided into fourths, the positions continue as:
0, 1/4, 2/4, 3/4, 1, 1 1/4, 1 1/2, 1 3/4, 2
The intervals remain equal throughout the number line. Extending the scale allows a line plot to represent fractional data that includes more than one whole.
How to Make a Line Plot with Fractions
Making a line plot with fractions requires the same general process as plotting whole numbers. However, choosing the correct scale takes more attention because the number line must include the fractional intervals needed to represent every observation.
Consider this data set:
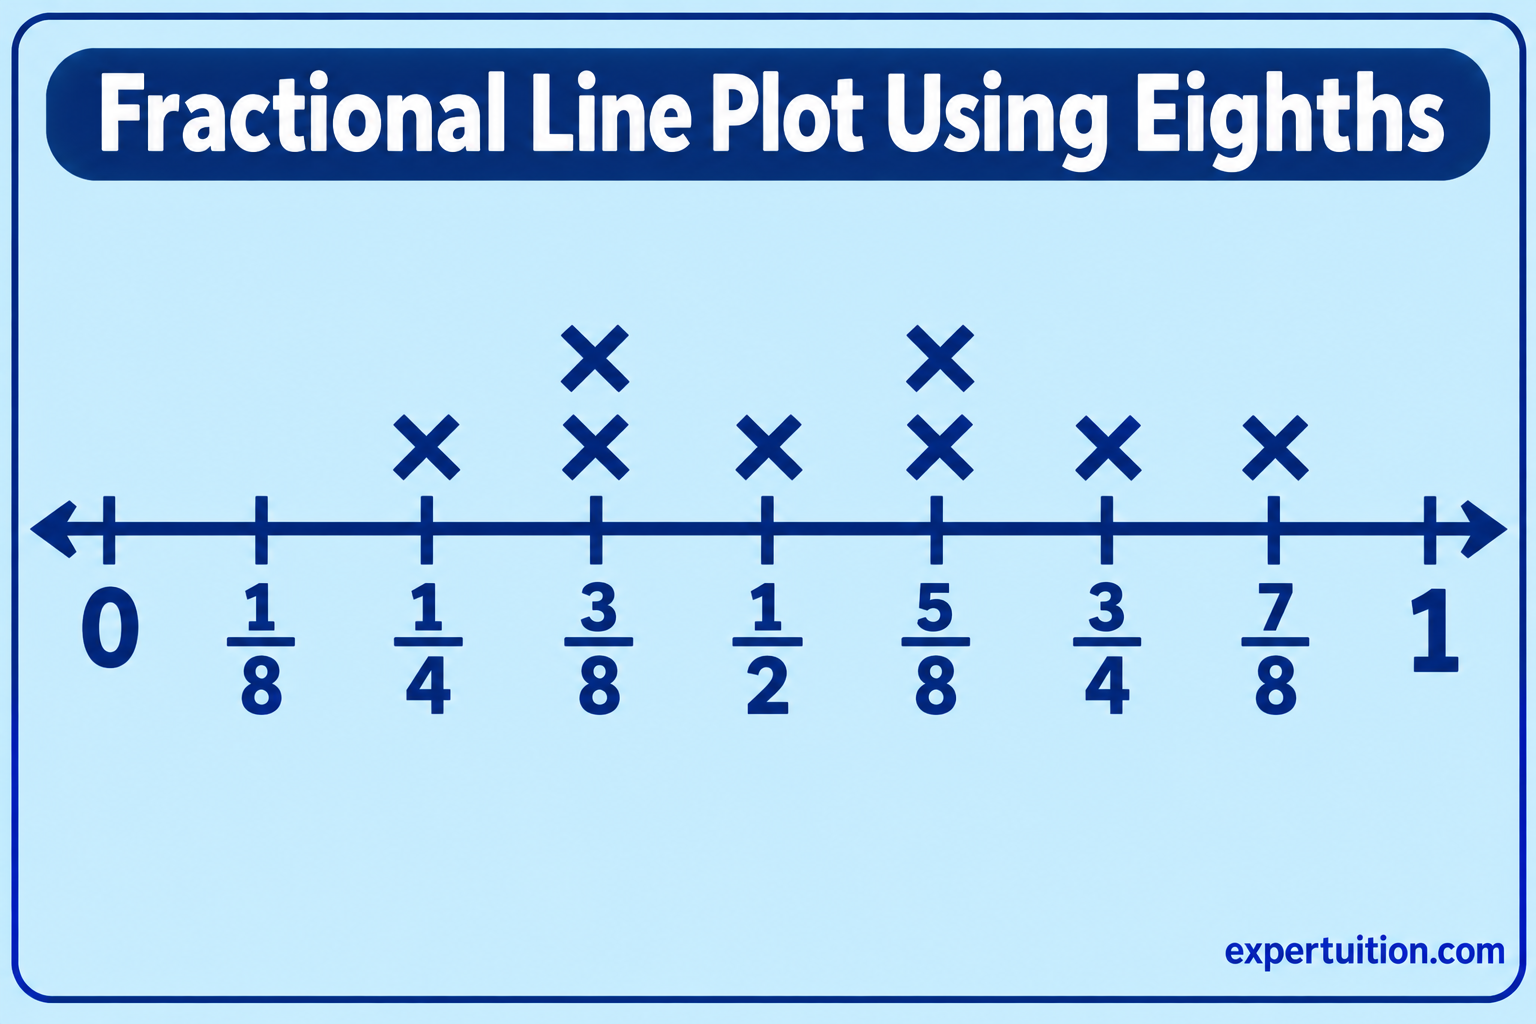
1/4, 3/8, 1/2, 3/8, 5/8, 3/4, 5/8, 7/8
Each value represents one observation. The completed line plot must show all eight observations at their correct positions.
Examine the Data and Choose the Correct Fractional Scale
Start by identifying the smallest and largest values and examining the denominators in the data set.
The smallest value is 1/4, and the largest is 7/8. The fractions have denominators of 4 and 8, so eighths provide a common fractional scale.
To choose a scale that can represent every value, express the fractions using eighths:
- 1/4 = 2/8
- 3/8 = 3/8
- 1/2 = 4/8
- 3/8 = 3/8
- 5/8 = 5/8
- 3/4 = 6/8
- 5/8 = 5/8
- 7/8 = 7/8
Eighths provide a suitable scale for this data set because all the values can be represented using eighths. Fourths can also be expressed as equivalent eighths.
A number line marked only in fourths does not provide labeled positions for 3/8, 5/8, or 7/8. These fractions fall between the fourths:
- 3/8 falls between 1/4 and 1/2.
- 5/8 falls between 1/2 and 3/4.
- 7/8 falls between 3/4 and 1.
Dividing each whole into eighths provides the additional positions needed to plot these values accurately.
Draw and Label the Fractional Number Line
Draw a horizontal number line from 0 to 1 and divide the interval into eight equal parts.
Label the positions:
0, 1/8, 2/8, 3/8, 4/8, 5/8, 6/8, 7/8, 1
You may also label equivalent positions using familiar fraction names. For example, 2/8 can be labeled 1/4, 4/8 can be labeled 1/2, and 6/8 can be labeled 3/4.
The labels must make the scale easy to follow. Avoid placing fractions at positions that do not match their numerical values.
Add a title that describes the data. If the fractions represent measurements, include the unit so readers know what the values measure.
Plot Fractional Values and Stack Repeated Values
Place one X above the position that represents each observation.
For the example data set, the frequencies are:
| Fraction | Equivalent Eighths | Frequency |
|---|---|---|
| 1/4 | 2/8 | 1 |
| 3/8 | 3/8 | 2 |
| 1/2 | 4/8 | 1 |
| 5/8 | 5/8 | 2 |
| 3/4 | 6/8 | 1 |
| 7/8 | 7/8 | 1 |
Place one X above 1/4, two above 3/8, one above 1/2, two above 5/8, one above 3/4, and one above 7/8.
The repeated values are stacked vertically, just as they are on a whole-number line plot. Equivalent forms share their numerical positions.
Verify the Accuracy of the Fractional Line Plot
Check the completed graph against the original data set. Focus on these details:
- The scale represents every fraction accurately.
- The fractional intervals are equal.
- Each fraction is placed at its correct position.
- The total number of X marks is eight, matching the original data set.
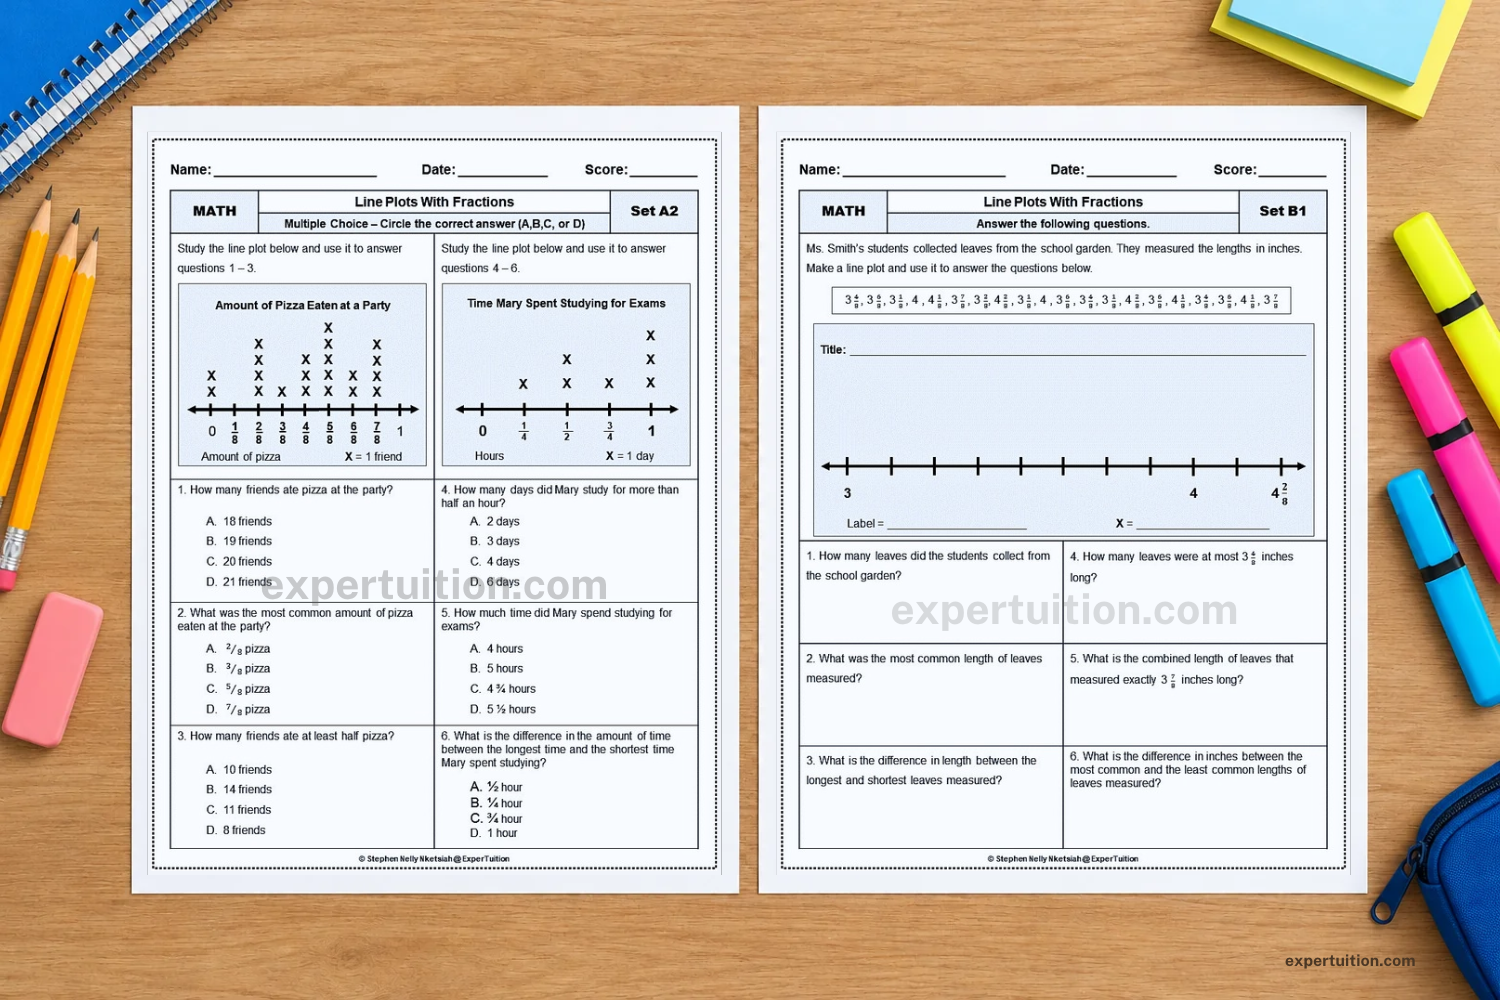
For more practice with fractional data, explore the Line Plots with Fractions Worksheets.
For practical strategies to introduce and teach fractional line plots in Grade 4, explore How to Teach Line Plots with Fractions in Grade 4.
How to Make a Line Plot with Mixed Numbers
A line plot can represent mixed numbers and other fractional values greater than one whole. The main steps are to choose a suitable fractional scale, extend the number line to cover the data, and plot each observation at its correct position.
Consider this data set:
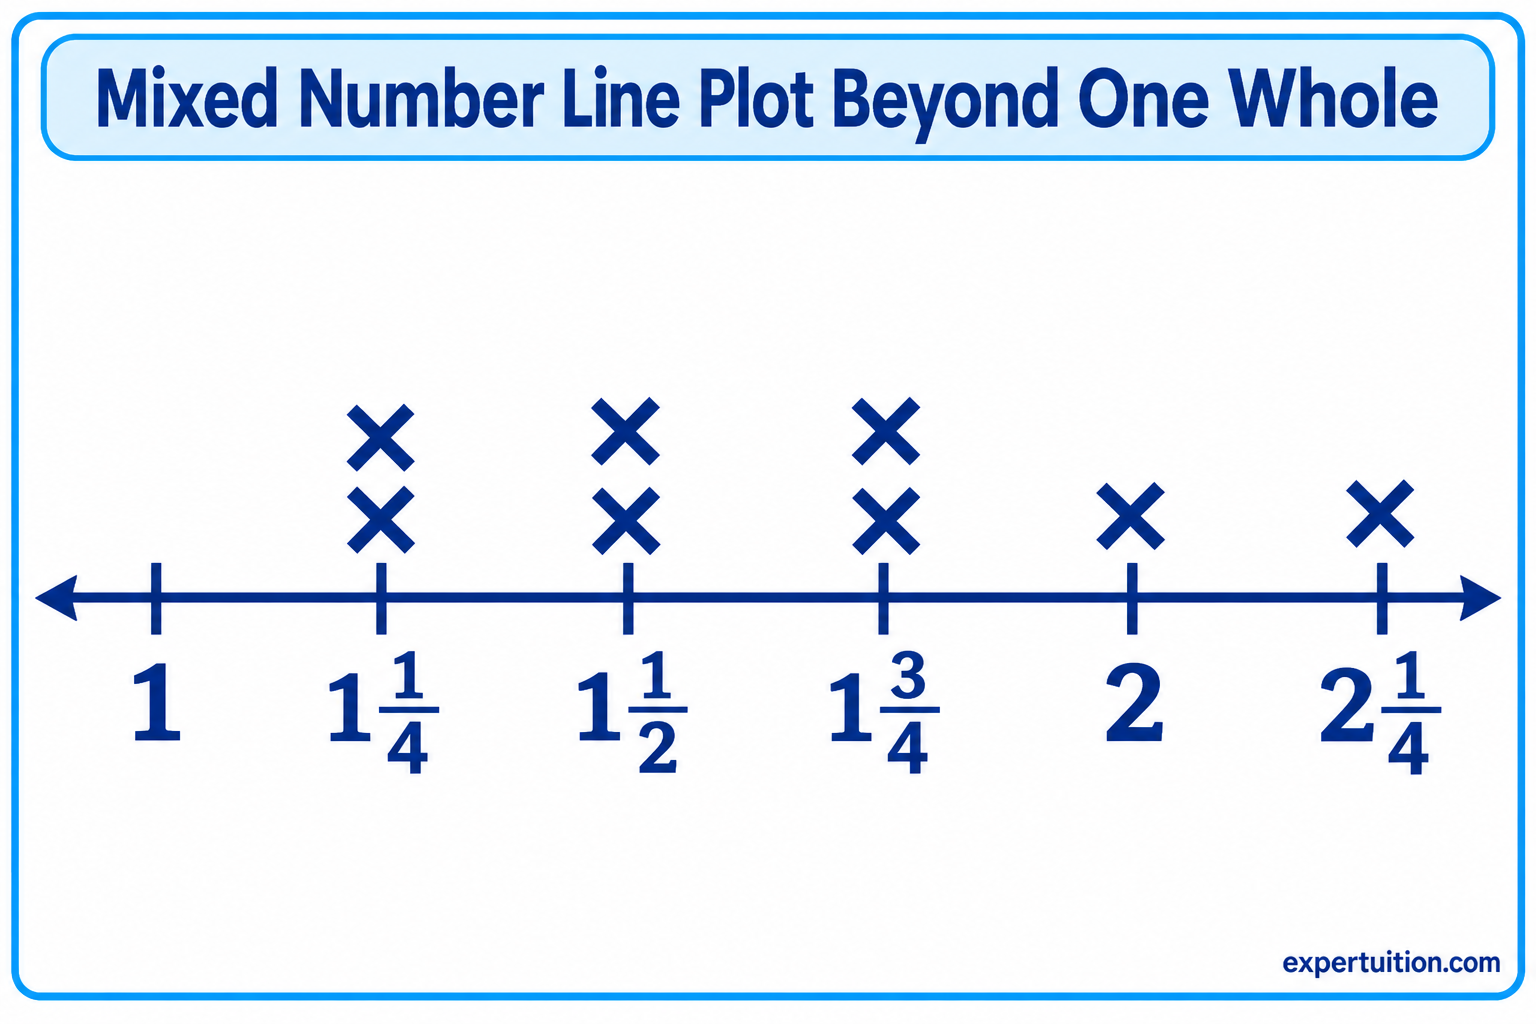
1 1/4, 1 1/2, 1 1/4, 1 3/4, 2, 1 1/2, 2 1/4, 1 3/4
The goal is to represent all eight observations on a line plot.
Examine the Data and Choose the Fractional Scale
Begin by identifying the smallest and largest values in the data set.
The smallest value is 1 1/4, and the largest is 2 1/4. The data includes fourths, so dividing each whole into four equal intervals provides a suitable scale.
The values can also be expressed as improper fractions:
- 1 1/4 = 5/4
- 1 1/2 = 6/4
- 1 3/4 = 7/4
- 2 = 8/4
- 2 1/4 = 9/4
Using fourths makes it easier to identify the correct position of each value on the number line.
Extend and Label the Number Line
Draw a horizontal number line that covers the data range, beginning at 1 and ending at 2 1/4. Divide each whole into four equal intervals.
Label the positions:
1, 1 1/4, 1 1/2, 1 3/4, 2, 2 1/4
The intervals must remain equal. The distance between 1 and 1 1/4 must be the same as the distance between 1 1/4 and 1 1/2. The same spacing continues across the entire number line.
A number line does not need to start at zero. It needs to cover the full range of the data while maintaining equal intervals.
Plot Mixed Numbers and Stack Repeated Values
Place one X above the position that represents each observation.
First, count how often each value appears.
| Mixed Number | Frequency |
|---|---|
| 1 1/4 | 2 |
| 1 1/2 | 2 |
| 1 3/4 | 2 |
| 2 | 1 |
| 2 1/4 | 1 |
Place two Xs above 1 1/4, two above 1 1/2, and two above 1 3/4. Place one X above 2 and one above 2 1/4.
The repeated values are stacked vertically, just as they are on line plots with whole numbers and proper fractions.
Verify the Completed Line Plot
Check the finished line plot to make sure it represents the original data accurately.
- The number line extends far enough to include every observation.
- Each whole is divided into four equal intervals.
- All mixed numbers are placed at their correct positions.
- The total number of X marks is eight, matching the original data set.
How to Read and Interpret Line Plots
Reading a line plot involves more than identifying the values along the number line. The marks show how often each value occurs, allowing readers to compare observations and draw conclusions about the data.
Identify Individual Values and Their Frequencies
Start by locating a value on the number line and counting the X marks directly above it.
For example, if a line plot has five Xs above 4, the value 4 appears five times in the data set. If there are two Xs above 6, the value 6 appears twice.
The number of X marks gives the frequency of the value. On a fractional line plot, four Xs above 3/8 mean that four observations have a value of 3/8. They do not mean the value is 4/8 or 12/8.
Identify the Greatest, Least, and Most Frequent Values
The number line makes it possible to identify several features of a data set.
- Least value: The smallest value represented, found farthest to the left.
- Greatest value: The largest value represented, found farthest to the right.
- Most frequent value: The value with the greatest number of X marks above it.
- Least frequent value: A value with the fewest X marks.
For example, if a line plot shows values from 2 to 8, the least value is 2 and the greatest value is 8. If 5 has the tallest stack of X marks, it is the most frequent value.
A line plot may have more than one most frequent value if two or more values share the highest frequency. It may also have several values with the same lowest frequency.
Compare Values and Find Differences
A line plot allows readers to compare numerical values by examining their positions on the number line.
For whole numbers, the difference between two values can be found through subtraction. If the greatest value is 9 and the least value is 3, the difference is:
9 − 3 = 6
The difference between the greatest and least values is called the range. In this example, the range is 6.
For fractions, the values may need to be expressed with a common denominator before subtracting.
For example, the difference between 3/4 and 1/4 is:
3/4 − 1/4 = 2/4 = 1/2
The difference is 1/2, not 2. When subtracting fractions with the same denominator, the numerator difference represents the number of fractional parts in the answer.
Comparisons can also involve frequency. A line plot may show that 1/2 occurs more often than 1/4, even though 1/2 is numerically greater. Keep the two questions separate: one compares the values, while the other compares how frequently they occur.
Recognize Patterns, Clusters, and Gaps in Data
The arrangement of marks can reveal patterns that may not be obvious in the original list of numbers.
A cluster occurs when many observations are grouped around a particular part of the number line. This suggests that values in that range appear frequently.
A gap is an interval or value with no observations. For example, a line plot might show several values between 2 and 5, no observations at 6, and more values between 7 and 9.
A line plot may also show whether data is spread across a wide range or concentrated within a smaller range.
These patterns help readers describe the overall distribution of the data. However, a gap does not automatically mean that a value is impossible or incorrect. It simply indicates that no observations in the data set have that value.
Using Line Plots to Solve Mathematical Problems
Line plots organize numerical information in a way that supports more than simple counting. Readers can use the data to answer questions, combine measurements, and solve problems involving addition and subtraction.
Answer Questions Using Whole-Number Data
Whole-number line plots can answer questions about totals, frequencies, and differences.
Suppose a line plot shows the number of books read by a group of people. The marks above each number indicate how many people read that number of books.
You can use the graph to answer questions such as:
- How many people read exactly 4 books?
- Which number of books was read most often?
- How many people are represented altogether?
- What is the difference between the greatest and least number of books read?
To find the total number of people, count all the X marks. To find the difference between the greatest and least values, subtract the smaller value from the larger one.
Each question requires a different interpretation of the same graph. Counting the marks gives the number of observations, while comparing the positions of the values provides information about the numerical data.
Solve Problems Involving Fractional Measurements
Fractional line plots are particularly useful when working with measurements such as lengths. The data can be used to find totals and differences between measurements.
For example, suppose two objects have lengths of 3/8 inch and 2/8 inch. Their combined length is:
3/8 + 2/8 = 5/8 inch
Because the denominators are the same, add the numerators and keep the denominator unchanged.
A subtraction problem might compare measurements of 7/8 inch and 3/8 inch:
7/8 − 3/8 = 4/8 = 1/2 inch
The difference between the two measurements is 1/2 inch.
Mixed numbers can also be combined. For example, adding 1 1/2 and 1/4 gives:
1 1/2 + 1/4 = 1 3/4
When using a line plot to solve these problems, identify the values being compared or combined before performing the operation. Also pay attention to the measurement unit so the answer is expressed correctly.
If the fractions have unlike denominators, find equivalent fractions with a common denominator before adding or subtracting. For example:
1/2 + 1/4 = 2/4 + 1/4 = 3/4
The number line provides a visual reference for the values, while fraction operations determine their sum or difference.
The Line Plots Worksheets Bundle offers additional practice with whole-number and fractional line plot problems. For a different practice format, the Line Plots Task Cards Bundle provides another way to work with both types of data.

Distinguish Between Counting Observations and Combining Their Values
One common source of confusion is treating the number of marks as though it were the combined value of the data.
Consider a line plot with three X marks above 1/2. This tells you that three observations have a value of 1/2.
If you combine the three measurements, the total is:
1/2 + 1/2 + 1/2 = 3/2 = 1 1/2
These answers describe two different things:
- Number of observations: 3
- Combined value: 1 1/2
Frequency tells how many times a value occurs. The combined value tells the total when those measurements are added together.
This distinction also applies to whole-number data. Four X marks above 3 represent four observations of 3. The number of observations is 4, while the combined value is:
3 + 3 + 3 + 3 = 12
The question being asked determines which answer is needed.
Common Mistakes When Working with Line Plots
Errors in line plots often happen when the scale, data marks, or numerical values are misunderstood. Checking these details helps ensure that the graph represents the original data accurately.
Using Unequal Number-Line Intervals
Every interval on a line plot must represent the same numerical distance.
For example, if the distance from 0 to 1/4 is twice the distance from 1/4 to 1/2, the scale is not accurate. The positions may look evenly spaced to the eye, but they do not represent equal numerical intervals.
Always divide the number line into equal parts before plotting the data.
Choosing a Scale That Cannot Represent Every Value
The scale must provide a position for every value in the data set. Choosing intervals that are too large can make it impossible to plot some fractions accurately.
For example, a number line divided only into fourths cannot provide labeled positions for 3/8, 5/8, or 7/8. These fractions fall between the fourths:
- 3/8 falls between 1/4 and 1/2.
- 5/8 falls between 1/2 and 3/4.
- 7/8 falls between 3/4 and 1.
A scale divided into eighths provides the necessary positions.
When fractions have different denominators, check that your chosen scale provides a position for every value.
Plotting Values Above the Wrong Number
Each X must be placed directly above the position that represents its value.
This can be challenging when working with fractions that have different denominators. For example, 1/4 belongs at 2/8 when the number line is divided into eighths. Placing it above 1/8 would give the fraction an incorrect numerical position.
Convert fractions to equivalent forms when necessary to identify their correct locations.
Treating Equivalent Fractions as Different Values
Equivalent fractions represent the same point on a number line.
For example, 1/2 and 4/8 are equal. They should be plotted at the same position, with their marks stacked together.
Creating separate positions for equivalent fractions makes the graph inaccurate and can lead to incorrect conclusions about the data.
Miscounting Repeated Values
Every occurrence in the original data set needs one X mark.
If a value appears three times, it must have three marks above it. Stacking the marks correctly is essential because the height of each stack represents frequency.
Use a frequency table before plotting when the data set contains several repeated values. Compare the table with the finished graph to check that no observations have been missed or counted twice.
Confusing Frequency with Numerical Value
The number of X marks above a value represents how often that value occurs, not the value itself.
For example, five marks above 2 mean that 2 appears five times. They do not mean that the data value is 5.
Keep the numerical position and the number of marks separate when interpreting the graph.
Misinterpreting the Information Presented
A line plot shows the observations included in a particular data set. It does not automatically explain why those values occurred or prove that the same pattern exists elsewhere.
For example, a cluster of values may indicate that many observations fall within a certain range. It does not, by itself, explain the reason for that pattern.
Read the title, labels, scale, and data marks together. These parts provide the context needed to interpret the information correctly.
Applying Line Plots to Different Types of Numerical Data
Line plots can represent whole-number counts, fractional measurements, and mixed numbers greater than one whole. The type of data determines the scale and the range needed on the number line.
Representing Whole-Number Data
Whole-number line plots are useful when observations are recorded as counts or measurements expressed in whole units. Examples include the number of books read, items collected, or goals scored, as well as lengths measured in whole inches and time recorded in whole minutes.
Use whole-number intervals when the data contains only whole-number values. Each observation receives one mark, and repeated values are stacked above the corresponding number.
Representing Fractional Data
Fractional line plots are useful when the data includes parts of a whole. Measurements are a common example because lengths, masses, and other quantities may include fractional units.
Examples include lengths measured in fourths or eighths of an inch, portions of a unit, and time intervals expressed as fractions of an hour. The same approach applies to measurements greater than one whole.
Choose equal fractional intervals that represent every observation. When values exceed one whole, extend the number line beyond 1 while maintaining the same interval size.
Choosing a Suitable Scale for Different Data Sets
The scale determines whether a line plot represents the data accurately. Choose it by examining the range and the level of precision in the observations.
Keep these principles in mind:
- Cover the full range: Include the smallest and largest values.
- Use equal intervals: Keep the numerical distance between consecutive positions consistent.
- Match the precision of the data: Use fractional divisions that can represent every observation.
- Label the scale clearly: Make sure readers can identify each value and understand any measurement units.
A suitable scale makes the differences between values clear without adding unnecessary divisions that make the graph harder to read.
For additional practice with whole-number and fractional line plots, explore the ExperTuition Line Plots Resource Collection.
Whether a data set contains whole numbers, fractions, or mixed numbers, the underlying principles remain the same: place values in numerical order, represent each observation with a mark, and stack repeated values at the same position. Once the scale matches the data, a line plot provides a clear way to organize, compare, and interpret numerical information.