Learn how to teach line plots with fractions in Grade 4 using measurement data. Show students how to mark fractional intervals, plot measurement data sets with X-marks, interpret the results, and solve addition and subtraction problems.
What Are Fractional Measurement Line Plots?
A line plot with fractions displays a set of measurement data along a number line. Instead of placing measurements only at whole numbers, the scale includes fractional values such as 1/2, 1/4, and 1/8. Each X-mark represents one measurement, and repeated measurements are shown by stacking X-marks above the same value.
In Grade 4, students move beyond making line plots with whole numbers and familiar fractions. They learn to represent measurements using fractional intervals, interpret the information, and solve addition and subtraction problems based on the data. These connected skills are the focus of CCSS 4.MD.B.4.
For example, students might measure the lengths of several short strips to the nearest eighth of an inch. A line plot organizes those measurements so students can see which lengths occur most often, compare the shortest and longest strips, and calculate differences or combined lengths.
The goal is not simply to teach students how to draw a graph. They need to understand what each mark represents and how to use the measurement information to solve problems.
Review the Grade 3 Skills Students Need Before Learning Line Plots with Fractions
Grade 3 provides two important foundations for working with fractional measurement line plots: reading and making line plots and locating fractions on a number line. Review these skills before introducing the more demanding Grade 4 work.
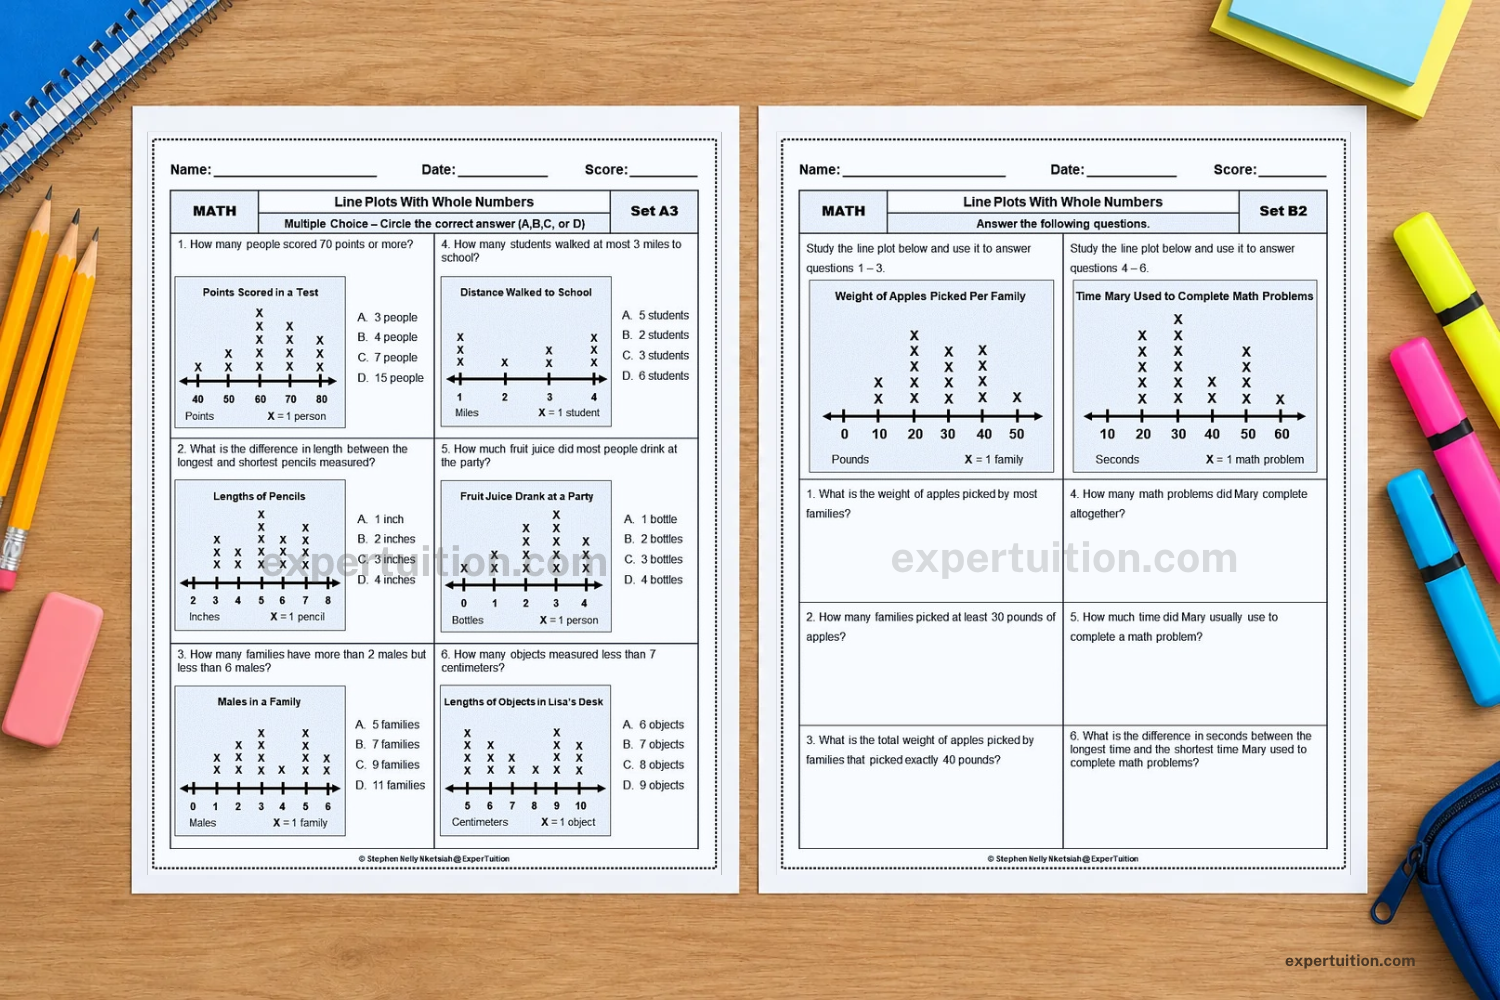
Review How to Read and Make Whole-Number Line Plots
Begin with a whole-number line plot to revisit how measurements or other numerical data are organized.
A line plot uses a horizontal number line to display a set of values. Each X-mark represents one observation. When the same value occurs more than once, the X-marks are stacked above that position.
For example, consider these whole-number measurements:
2 inches, 3 inches, 3 inches, 4 inches, 4 inches, 4 inches, and 5 inches.
The corresponding line plot would have:
- One X-mark above 2.
- Two X-marks above 3.
- Three X-marks above 4.
- One X-mark above 5.
Use the plot to review how to:
- Read values from a horizontal number line.
- Match each X-mark to a data value.
- Count how many times a value occurs.
- Identify the smallest and largest measurements.
- Compare values and answer questions about the data.
Draw attention to the relationship between the original data and the marks on the plot. If the data set contains seven measurements, the completed plot must contain seven X-marks. The number of X-marks stacked above a value shows how often that measurement occurs.
Grade 3 students are expected to generate measurement data by measuring lengths with rulers marked in halves and fourths of an inch, then display the results on a line plot using an appropriate whole-number, half-inch, or quarter-inch scale. This is the foundation described in CCSS 3.MD.B.4.
If students need additional practice with whole-number plots, use Line Plots with Whole Numbers Worksheets for focused review.
Review Fractions on a Number Line
Before students work with fractional measurement data, revisit how fractions are positioned on a number line.
A fraction represents a number of equal parts of a whole. The denominator tells how many equal parts make up one whole, while the numerator tells how many of those parts are being considered.
Use a number line from 0 to 1 to review familiar fractions:
- Divide the interval from 0 to 1 into two equal parts to locate 1/2.
- Divide it into four equal parts to locate 1/4, 2/4, and 3/4.
- Identify 3/4 as three of the four equal parts.
Connect these positions to a ruler. On a ruler marked in fourths of an inch, the distance between consecutive quarter-inch marks is 1/4 inch. The same principle applies when the scale is divided into halves or eighths.
Fraction strips and number-line models can help students see that fractional positions are based on equal partitions, not arbitrary marks. Have students locate fractions, name the values at marked positions, and explain how they know where each fraction belongs.
Make the connection between these two representations explicit. Students first use a number line to locate fractional values. They then use those same positions as the measurement scale for a line plot. The difference is that a line plot uses X-marks above each value to show how many measurements fall at that position.
Teach Students to Understand Fractional Intervals on a Number Line
A fractional line plot depends on an accurately divided number line. Students need to understand what each interval represents before they can choose a scale or plot measurements correctly.
Show How to Divide Whole Units into Halves, Fourths, and Eighths
Start with a number line from 0 to 1. Divide the interval into two equal parts, then four equal parts, and finally eight equal parts.
The resulting positions are:
| Fractional unit | Positions between 0 and 1 |
|---|---|
| Halves | 1/2 |
| Fourths | 1/4, 2/4, 3/4 |
| Eighths | 1/8, 2/8, 3/8, 4/8, 5/8, 6/8, 7/8 |
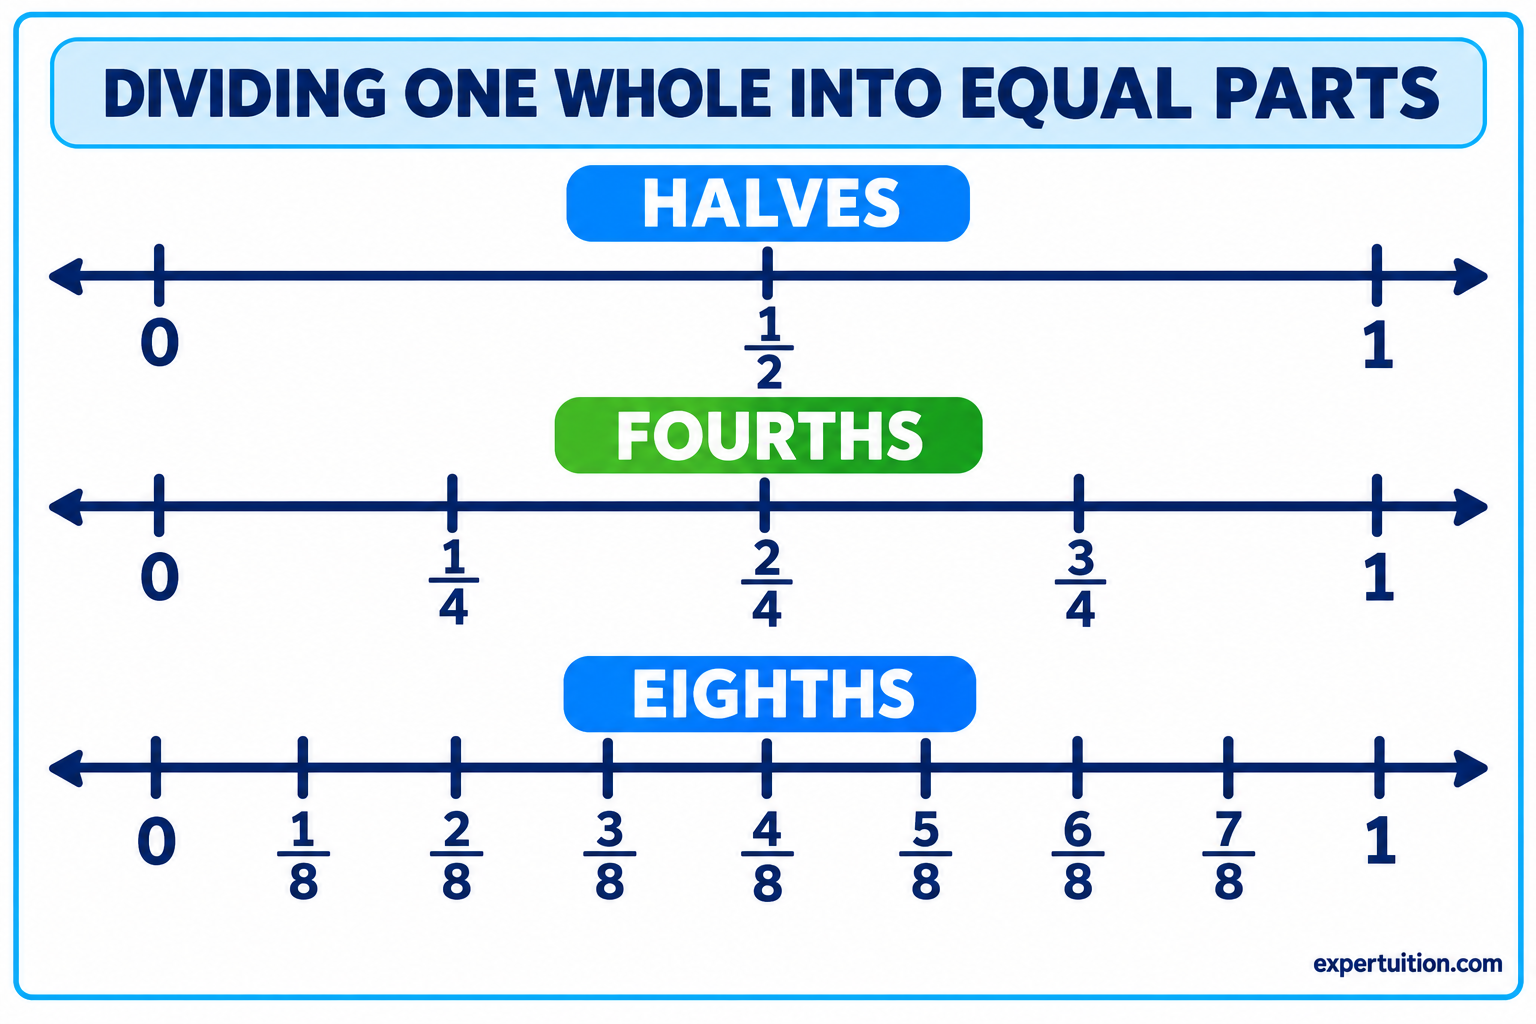
Use the models to compare the size of the intervals. Dividing one whole into two equal parts creates larger intervals than dividing it into four or eight equal parts.
This distinction matters when students choose a scale for a line plot. If the data includes measurements such as 1/8 inch, 3/8 inch, and 5/8 inch, a scale marked only in fourths will not show every measurement at its correct position.
Connect each partition to a ruler marked in the same fractional unit. A ruler divided into eighths has eight equal intervals within each inch. Students should be able to explain what one interval represents and why the spaces between consecutive marks must be equal.
Use fraction strips, ruler illustrations, and number lines together. Each model shows the same fractional relationships in a different way.
Teach Equivalent Fractions Using a Common Number Line
Students may encounter measurements written with different denominators even when the fractions represent the same length. They need to recognize equivalent fractions so that they can locate those measurements consistently.
Use a number line divided into eighths to show these relationships:
- 1/2 = 2/4 = 4/8
- 1/4 = 2/8
- 3/4 = 6/8
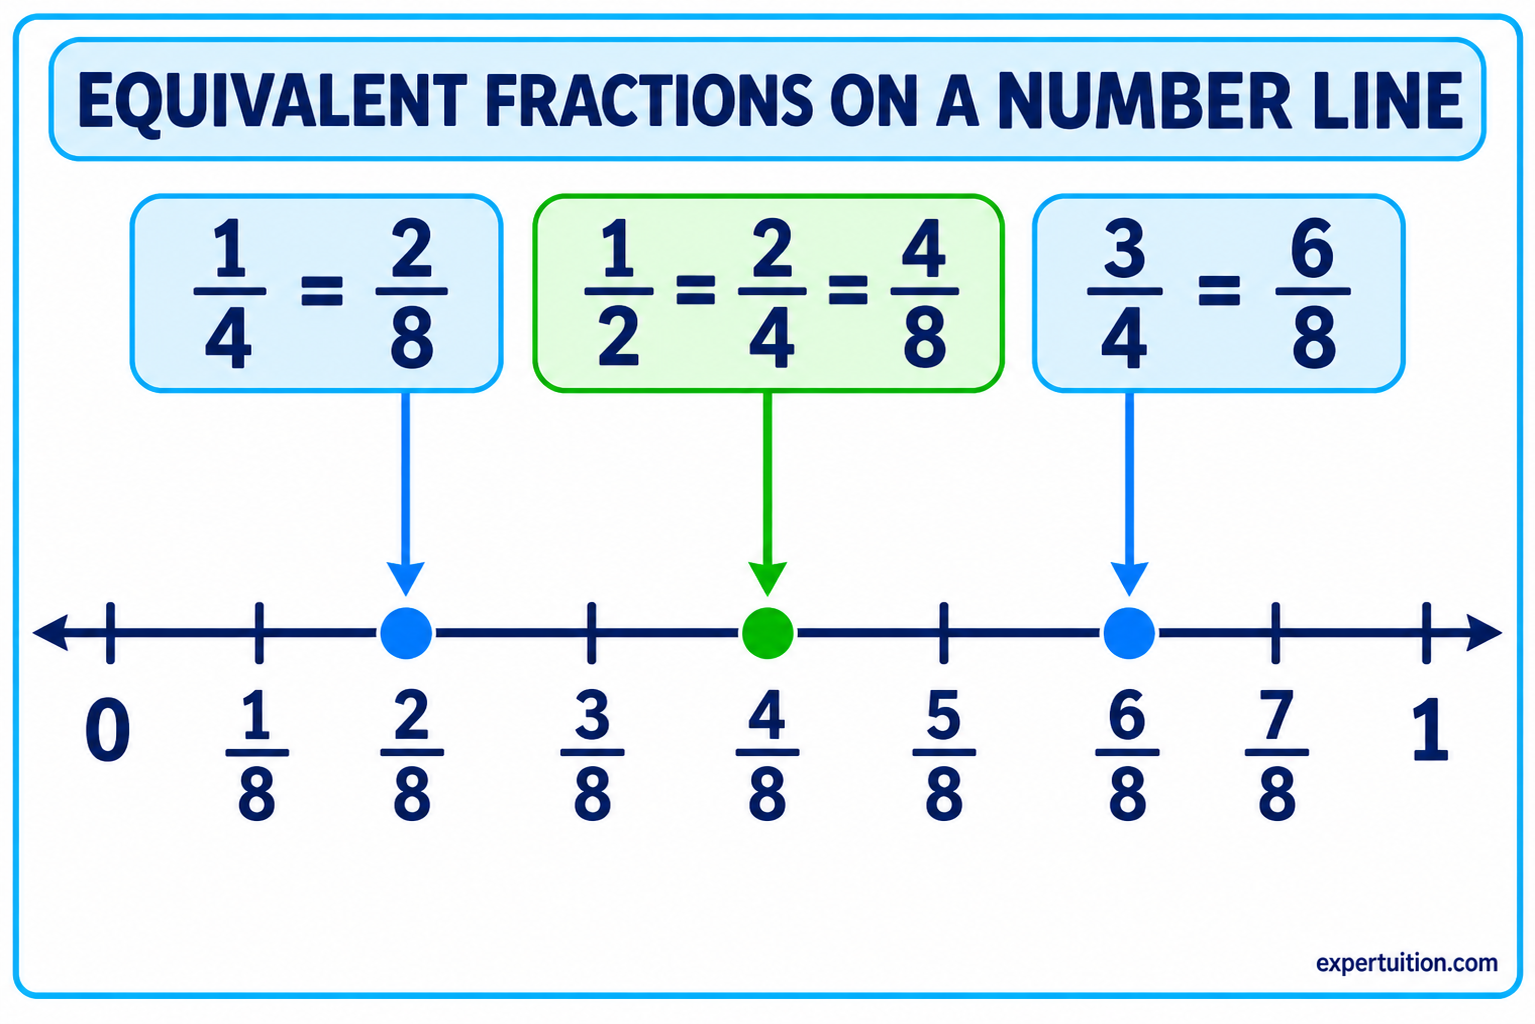
For example, 1/2 and 4/8 name the same point on a number line. The fractions look different, but they represent the same distance from zero.
Align fraction strips or number lines to make these relationships visible. Have students locate 1/2 on a number line marked in fourths, then locate the same position on a number line marked in eighths. Compare the labels and discuss why the position does not change.
When a line plot uses eighth-inch intervals, measurements such as 1/4, 1/2, and 3/4 must be placed at 2/8, 4/8, and 6/8, respectively. These are equivalent names for the same positions, not additional measurement values. A measurement of 1/2 inch belongs above 4/8 on a line plot divided into eighths. Students should not create separate marks above 1/2 and 4/8 because both labels identify the same measurement.
How to Make a Line Plot with Fractions
When students understand fractional intervals, guide them through constructing a line plot from a measurement data set. Model the process with one example and keep the same data set as you explain how to select a scale, label the number line, plot the measurements, and check the completed graph.
You can provide students with a measurement data set or have them collect measurements as an additional activity. The focus of the standard is on representing and using the measurement data in a line plot.
Consider the following measurements of eight short strips, recorded to the nearest eighth of an inch:
1/4, 3/8, 3/8, 1/2, 5/8, 5/8, 3/4, 7/8 inch
Examine the Measurement Data and Choose an Appropriate Scale
Before drawing the number line, examine the data set.
Identify the smallest and largest measurements. In this example, the shortest measurement is 1/4 inch and the longest is 7/8 inch.
Next, look at the fractional units used in the data. The measurements include eighths, so the number line needs to show eighth-inch intervals. A scale marked only in halves or fourths would not provide a separate position for every measurement. For example, a scale marked in fourths cannot show 3/8 or 5/8 at their exact positions.
The data ranges from 1/4 inch to 7/8 inch. However, using a number line that begins at 0 and extends to 1 inch makes the fractional positions easier to interpret. Divide the interval from 0 to 1 into eight equal parts.
When choosing a scale, consider:
- The smallest and largest values: The number line must cover the entire range of measurements.
- The fractional units: The intervals must be small enough to represent every measurement accurately.
- Equal spacing: Every interval must represent the same fractional amount.
- Clear labels: Whole numbers and relevant fractional positions must be easy to identify.
Do not choose a scale simply because it looks convenient. The scale must match the measurement data.
Label the Number Line and Plot Each Measurement
Once you have selected the scale, model how to represent the data.
- Draw a horizontal number line from 0 to 1 inch.
- Divide the interval into eight equal parts.
- Label the positions in eighths: 0, 1/8, 2/8, 3/8, 4/8, 5/8, 6/8, 7/8, and 8/8.
- Label the number line Length (inches) to show the measurement unit.
- Add a descriptive title that tells what the measurements represent.
- Match each measurement in the data set to its position on the number line.
- Place one X-mark above the correct position for each measurement.
- Stack X-marks vertically when a measurement occurs more than once.
For the example data set, the completed plot would have:
| Measurement | Number of X-marks |
|---|---|
| 1/4 inch | 1 |
| 3/8 inch | 2 |
| 1/2 inch | 1 |
| 5/8 inch | 2 |
| 3/4 inch | 1 |
| 7/8 inch | 1 |
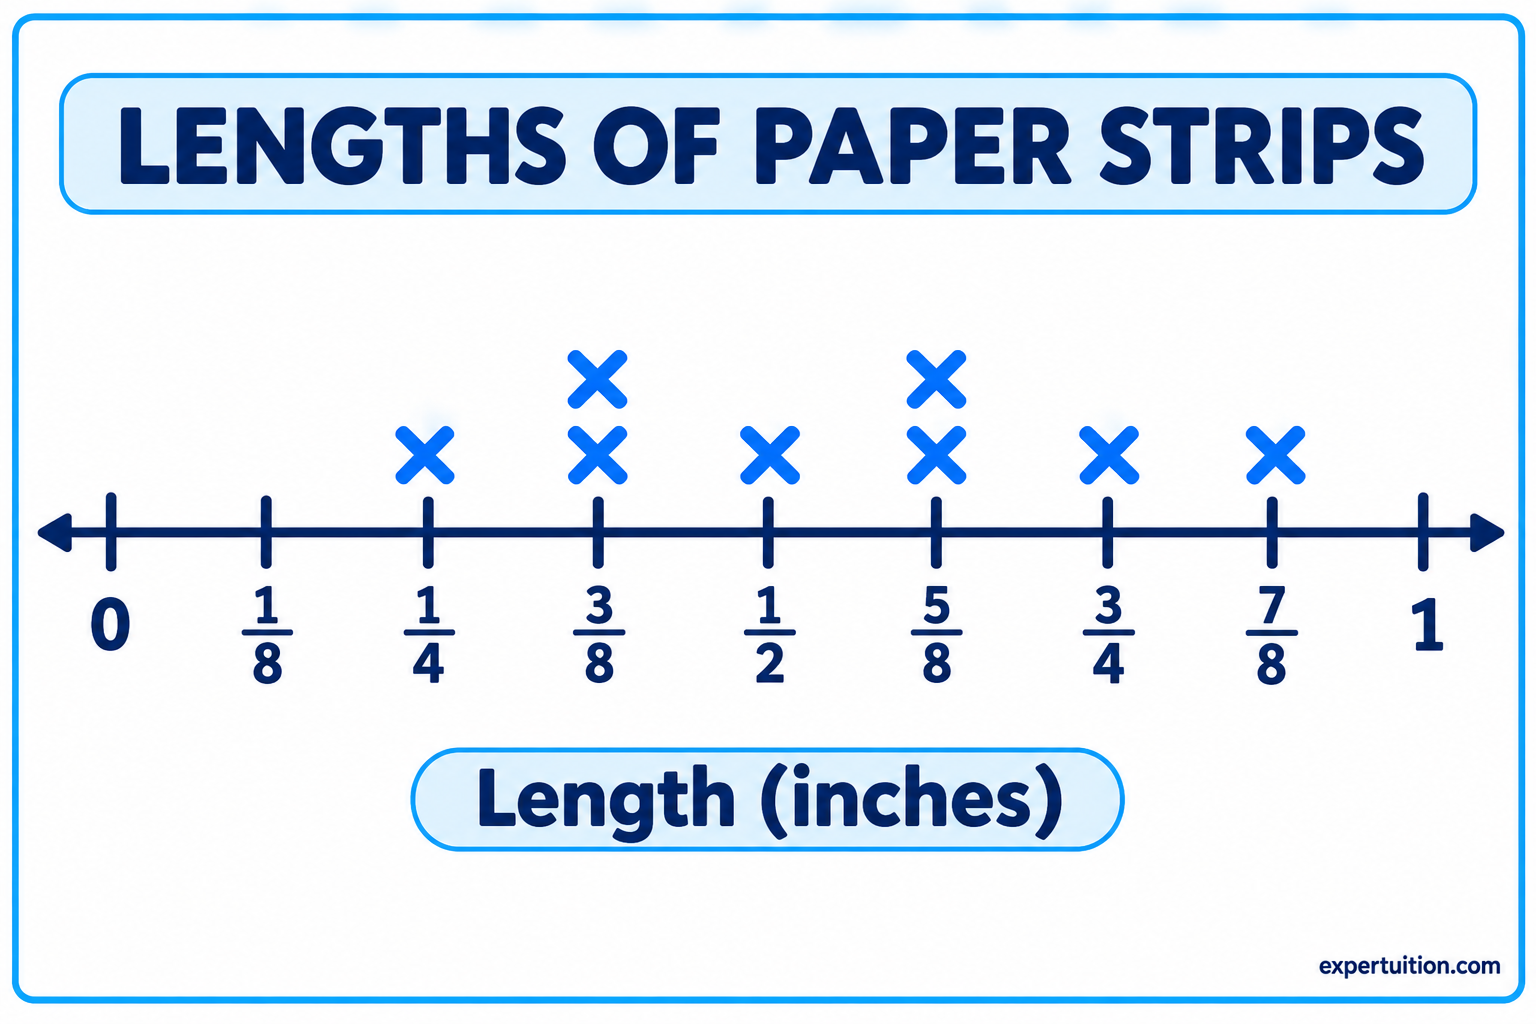
Remember that 1/4 is equivalent to 2/8, 1/2 is equivalent to 4/8, and 3/4 is equivalent to 6/8. If the number line is labeled in eighths, those equivalent positions must be used when plotting the measurements.
Explain why each X-mark belongs above its position. For instance, the two measurements of 3/8 inch produce two X-marks above 3/8, not one mark above 3/8 and another above a different fractional label. Each X represents one strip, and the number of X-marks above a value shows how many strips have that measurement.
Check the Accuracy of the Completed Line Plot
After plotting the data, check the graph against the original measurements.
Use these questions to guide the review:
- Are the intervals equal?
- Does every label match its position on the number line?
- Are equivalent fractions represented at the same location?
- Does each measurement have one X-mark?
- Are repeated measurements stacked above the correct value?
- Does the total number of X-marks match the number of measurements in the data set?
The example contains eight measurements, so the completed line plot must contain eight X-marks.
Have students compare the graph with the original data rather than checking only whether the plot looks neat. A line plot can be evenly spaced and clearly labeled but still contain errors if a measurement is placed at the wrong fractional position.
How to Read and Interpret Line Plots with Fractions
Constructing a line plot is only part of the work. Students must also read the fractional scale, interpret the data, and use the information to answer questions.
Identify and Compare Fractional Measurements
Begin with questions that require students to read individual values and count the X-marks above them.
Using the strip data set, students can answer questions such as:
- How many strips measured 3/8 inch?
- Which measurement occurred most often?
- What was the shortest measurement?
- What was the longest measurement?
- How many strips measured at least 5/8 inch?
For the example:
- Two strips measured 3/8 inch.
- The most frequent measurements were 3/8 inch and 5/8 inch, with two strips at each value.
- The shortest measurement was 1/4 inch.
- The longest measurement was 7/8 inch.
- Four strips measured at least 5/8 inch.
Move from direct reading questions to comparisons. For example, ask students how many eighths of an inch longer the longest strip was than the shortest strip. They can identify 7/8 and 1/4 on the scale, rewrite 1/4 as 2/8, and determine the difference.
Help students use the scale rather than guessing from the visual spacing. The labels identify the measurements, while the X-marks show how many times each measurement occurs.
Distinguish Between the Number of Measurements and Their Combined Length
One common source of confusion is the difference between counting measurements and adding their values.
Counting the X-marks tells you how many measurements were recorded. Adding the values represented by those marks gives you their combined measurement.
For example, using the line plot, two strips measure 5/8 inch each.
- Number of measurements: 2 strips.
- Combined length: 5/8 + 5/8 = 10/8 = 1 1/4 inches.
The answer depends on what the question asks. If a problem asks how many strips were measured at 5/8 inch, the answer is 2. If it asks for their combined length, the answer is 1 1/4 inches.
Use examples like this before introducing more involved line plot problems. Students need to recognize that an X-mark represents an observation with a measurement value, not simply a unit to count or add without considering the question.
How to Solve Fraction Problems Using Line Plots
Grade 4 students must use information from line plots to solve problems involving fraction addition and subtraction. This requires more than reading values from a graph. Students must identify the relevant measurements, choose the correct operation, calculate accurately, and explain what the answer means in the measurement context.
Connect the work to students’ understanding of adding and subtracting fractions with like denominators. CCSS 4.NF.B.3.d addresses solving word problems involving addition and subtraction of fractions that refer to the same whole and have like denominators.
Teach Fraction Addition Using Line Plot Data
Use line plot data to show how measurements can be combined.
Return to the strip example. Two strips measure 3/8 inch each, and another measures 1/2 inch. To find their combined length, add the three measurements.
First, express the fractions using the same denominator:
1/2 = 4/8
Then write the addition sentence:
3/8 + 3/8 + 4/8 = 10/8 = 1 2/8 = 1 1/4 inches
The combined length is 1 1/4 inches.
Show students how the line plot provides the measurements needed for the calculation. The two X-marks above 3/8 identify two strips with that measurement, while the X-mark above 1/2 identifies the third strip.
Connect the calculation to a visual model. Students can combine eighth-inch intervals to see that ten eighths make one whole and two additional eighths. This makes the conversion from 10/8 to 1 1/4 easier to interpret.
When teaching addition with line plot data:
- Identify which measurements the problem asks you to combine.
- Use the X-marks to determine how many times each measurement occurs.
- Write an addition expression using the relevant values.
- Add fractions with like denominators.
- Express the result as a fraction or mixed number when appropriate.
- Include the correct measurement unit in the answer.
Make sure students understand why they are adding the selected measurements. The line plot provides the data, but the wording of the problem determines which values belong in the calculation.
Teach Fraction Subtraction Using Line Plot Data
Fraction subtraction allows students to compare measurements and find the difference between them.
A useful starting point is the difference between the longest and shortest measurements on a line plot. This is also the type of problem highlighted in the example provided in 4.MD.B.4.
Using the strip data set:
- Longest measurement = 7/8 inch.
- Shortest measurement = 1/4 inch.
To find the difference, rewrite 1/4 as 2/8:
7/8 − 2/8 = 5/8 inch
The longest strip is 5/8 inch longer than the shortest strip.
Use the number line to show the distance between 2/8 and 7/8. Students can count five eighth-inch intervals between the two positions. This visual approach connects subtraction to the distance between two measurements.
You can also use the plot to compare any two values. For example, the difference between 5/8 inch and 3/8 inch is:
5/8 − 3/8 = 2/8 = 1/4 inch
When teaching subtraction:
- Identify the two measurements being compared.
- Determine which measurement is greater.
- Write the subtraction expression in the correct order.
- Subtract fractions with like denominators.
- Interpret the difference using the measurement unit.
Students should recognize that subtraction answers a question about how much longer or shorter one measurement is than another. The result is a difference in length, not the number of X-marks between the values.
Guide Students Through Measurement Word Problems
Once students can add and subtract fractional measurements from a line plot, use word problems to develop their ability to select and apply the relevant information.
A line plot may contain several values, but a problem will not always require every measurement. Students need to identify what the problem asks and determine which values are relevant.
Use a consistent problem-solving process:
- Read the problem: Identify what needs to be found.
- Examine the line plot: Locate the measurements that provide the required information.
- Choose an operation: Decide whether the problem involves combining measurements or finding a difference.
- Write an expression: Represent the selected measurements with an addition or subtraction sentence.
- Calculate: Solve using appropriate fraction strategies.
- Interpret the answer: State what the result means and include the measurement unit.
For example:
A line plot shows that two pieces of ribbon measure 3/8 yard each. What is their combined length?
Students locate the two X-marks above 3/8 and write:
3/8 + 3/8 = 6/8 = 3/4 yard
The combined length is 3/4 yard.
For a subtraction problem, students might use the longest and shortest measurements on the plot to determine how much longer one object is than the other.
As students gain confidence, make the questions less direct. Instead of telling them which measurements to use, ask them to identify the relevant values and explain why they selected them. This shows whether they can interpret the data and connect it to the mathematical operation.
Common Student Mistakes When Working with Fractional Line Plots
Students may make errors because they misunderstand fractions, misread the number line, misrepresent the data, or choose an inappropriate operation. Identify the source of the difficulty before deciding what to review.
Misplacing Fractions on the Number Line
A student may place 3/8 at the position for 1/4 or 1/2 instead of recognizing that it lies exactly halfway between the two values.
Use fraction strips, rulers, and number lines to compare positions. Have students explain how many equal intervals separate each value from zero.
Confusing Halves, Fourths, and Eighths
Students may treat 1/2, 2/4, and 4/8 as different measurements because the fractions have different numerators and denominators.
Show the fractions on aligned number lines or fraction strips. Emphasize that equivalent fractions occupy the same position and represent the same amount.
Creating Unequal Fractional Intervals
A number line may contain uneven spaces between fractional labels. This makes the scale inaccurate, even if the labels themselves are correct.
Model how to divide one whole into equal parts before adding labels. Have students check the distance between consecutive marks and explain what each interval represents.
Miscounting Measurements
Students may overlook an X-mark, count a stacked group incorrectly, or assume that each column represents only one measurement.
Return to the original data set. Match each measurement to one X-mark and count the completed plot to confirm that every observation is represented.
Confusing the Number of Observations with the Combined Measurement
A student may count three X-marks above 1/2 and give 3 as the total length, even when the problem asks for the combined measurement.
Use the distinction explicitly: three X-marks represent three measurements, while the combined length is 1/2 + 1/2 + 1/2 = 1 1/2 inches.
Making Errors When Adding or Subtracting Fractions
Students may add denominators, subtract fractions in the wrong order, or choose an operation without considering the problem.
Use visual models and number lines to connect the calculation to the measurements. Review addition and subtraction with like denominators, and have students explain what the result represents.
Omitting Measurement Units
A student may calculate 5/8 but leave out inches, yards, or another unit from the answer.
Include the unit in worked examples and written responses. Ask students to explain what the fraction measures, not just state the numerical result.
When an error occurs, look beyond the final answer. A student who misplaces 3/8 on the number line needs a different review from one who reads the plot correctly but subtracts incorrectly.
How to Assess Students’ Understanding of Fractional Line Plots
Identify the Skills Students Need to Demonstrate
Assess the full range of skills in 4.MD.B.4, not just whether students can draw a line plot. Students need to demonstrate that they can work with fractional intervals, construct an accurate plot, interpret the data, and solve addition and subtraction problems using the information presented.
Use short tasks throughout instruction to identify gaps before moving to more complex problems.
- Fractional intervals: Give students a number line and ask them to locate halves, fourths, and eighths. Include equivalent fractions to check whether they recognize values that occupy the same position.
- Line plot construction: Provide a set of fractional measurement data. Have students select an appropriate scale, label the number line, plot every measurement, and check their work.
- Data interpretation: Ask students to identify the smallest and largest measurements, count how many observations occur at a particular value, and compare measurements.
- Fraction addition: Give students a problem that requires combining measurements from the plot. Check whether they select the correct values, write an accurate expression, and interpret the result.
- Fraction subtraction: Ask students to find a difference between two measurements, such as the longest and shortest values. Check both the calculation and the measurement unit in the answer.
Include a few questions that reveal whether students understand the concepts behind their work:
- Why does a line plot divided into eighths show 1/2 at 4/8?
- What does each X-mark represent?
- How many measurements are represented by the completed line plot?
- How would you find the combined length of all the strips?
- Why must you use a common denominator when adding measurements?
These questions help identify whether a student understands the fractional scale, the meaning of the X-marks, and the calculations based on the data, rather than just whether they can follow a procedure.
Use Assessment Questions and Results to Guide Instruction
Exit tickets, independent worksheets, and short problem-solving tasks can provide useful evidence of individual understanding.
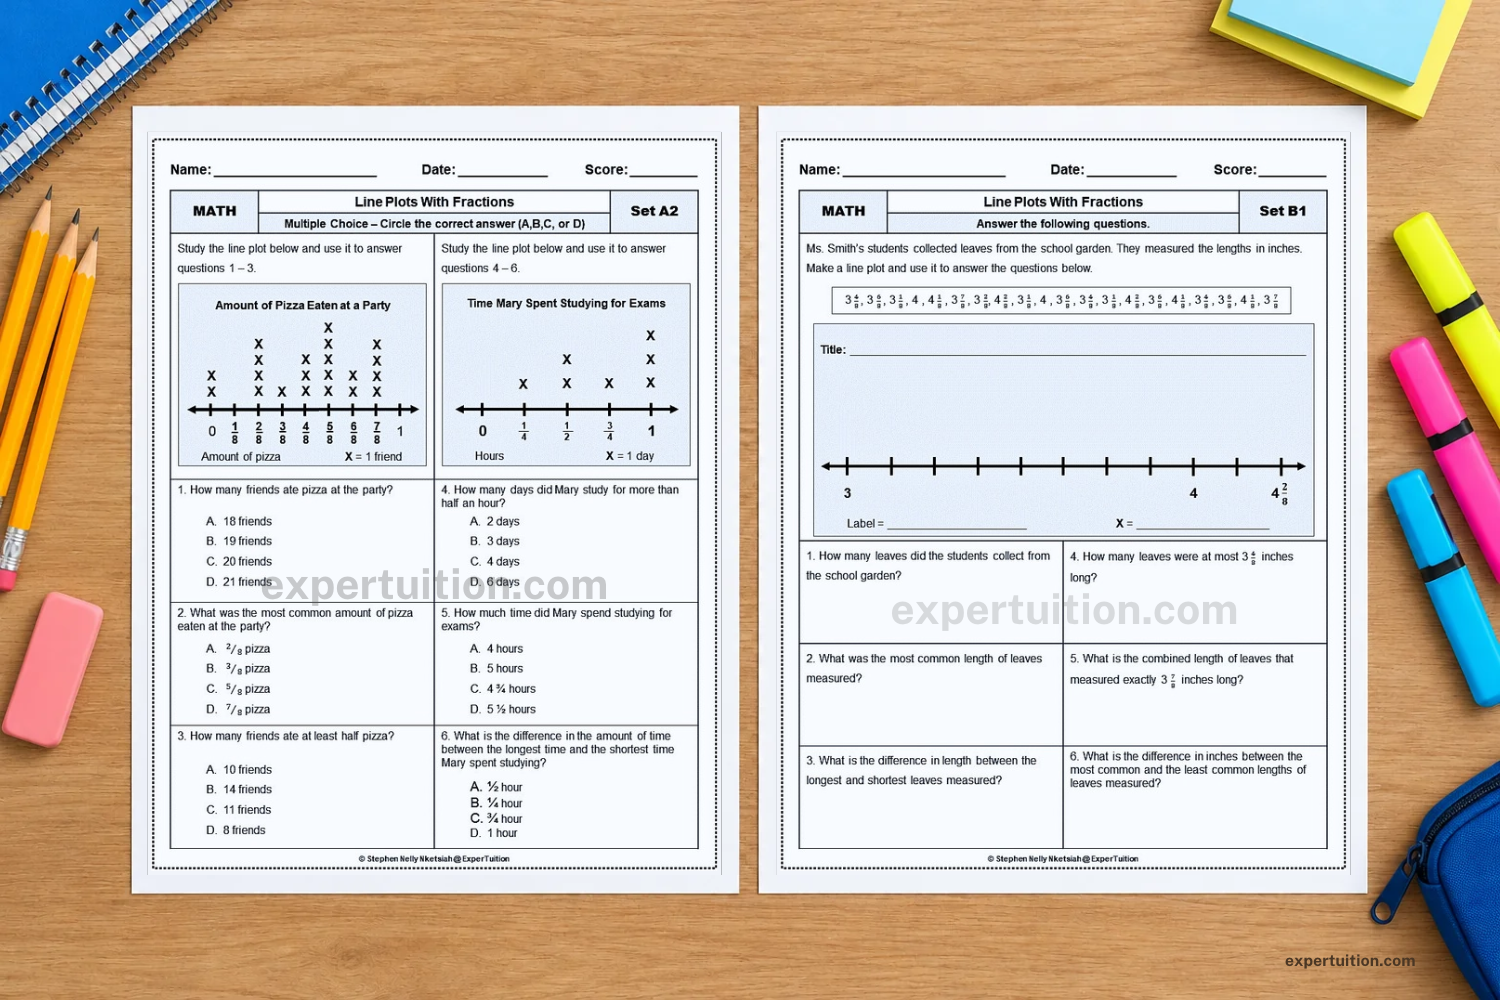
For more focused practice, Line Plots with Fractions Worksheets include multiple-choice and open-ended questions, answer keys, and a data tracker. Line Plots with Fractions Task Cards provide additional questions for independent practice, partner work, or Math centers.
Use assessment results to decide what to revisit. Students who struggle to locate fractions may need more number-line work. Those who construct accurate plots but misinterpret the data need practice reading and comparing values. Students who understand the plot but make calculation errors may need additional fraction addition and subtraction practice.
A student has demonstrated the full expectation when they can independently make a line plot from fractional measurement data, interpret the information, and use it to solve relevant addition and subtraction problems.
Help Students Apply Fractional Line Plot Skills with Confidence
Fractional measurement line plots bring together skills that students develop over time. A strong understanding of fractions and number lines gives them the foundation to construct accurate plots. Reading and interpreting those plots then prepares them to use measurement data in addition and subtraction problems.
Move from familiar whole-number plots and visual fraction models to teacher modelling, guided practice, and independent problem-solving. As students work, pay attention to whether they can explain their choices, not just whether they produce the correct graph or calculation.
In Grade 5, students extend this work by applying fraction operations to solve more complex problems involving line plot data, including situations that require dividing a total measurement equally among several quantities. This builds on the Grade 4 foundation without changing the focus of this lesson. See the Grade 5 standard, 5.MD.B.2.
By the end of Grade 4, students should be able to do more than place X-marks on a number line. They should understand how the plot represents measurement data and how that information can help them solve mathematical problems.
SAVE WITH BUNDLES (20% – 25% OFF)
-
Product on sale
 Original price was: $ 6.50.$ 5.20Current price is: $ 5.20.
-
Product on saleOriginal price was: $ 6.50.$ 5.20Current price is: $ 5.20.
-
Product on saleOriginal price was: $ 13.00.$ 9.76Current price is: $ 9.76.