Line plots are one of those math topics that blend data, number sense, and visual reasoning beautifully. In this post, we’ll explore how to teach line plots effectively, from whole numbers to fractions, with strategies, engaging activities, and ready-to-use classroom tools to support student success.
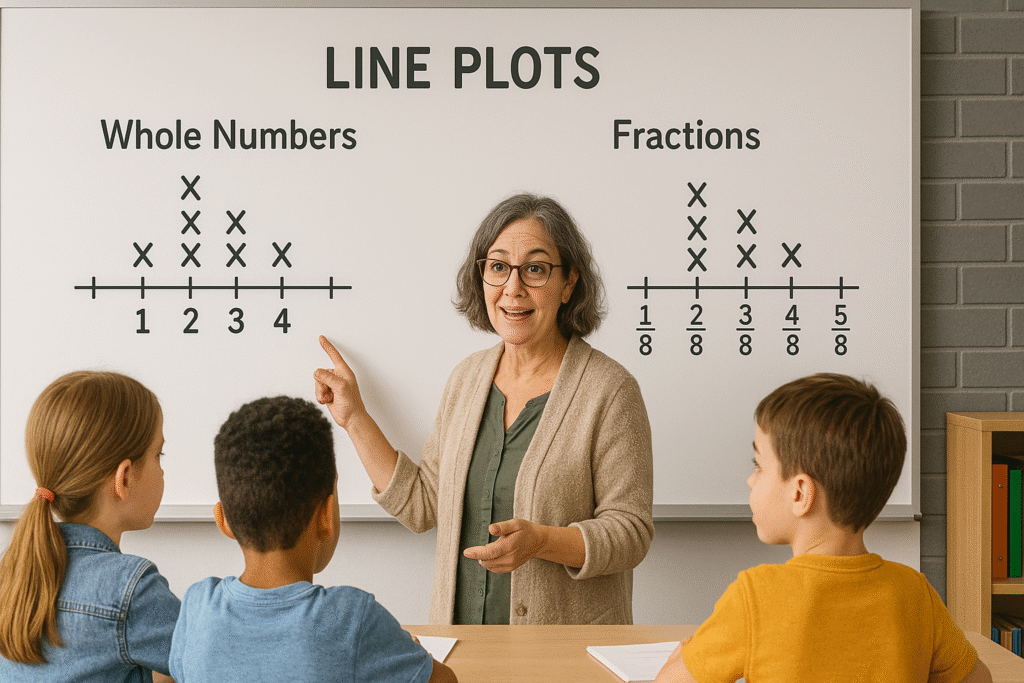
Understanding Line Plots
A line plot is a graph that displays data along a number line.
Each “X” (or dot) shows how many times a particular value appears.
Line plots are great for helping students see patterns and trends in data at a glance.
They learn to ask and answer questions like:
- Which value occurs most often?
- How many data points are above or below a certain number?
- What’s the difference between the highest and lowest values?
Unlike bar graphs, line plots emphasize individual data values, which helps strengthen number sense and understanding of numerical order.
When students are comfortable plotting whole numbers, they’re ready to move on to fractions, where they’ll practice locating fractional parts on a number line.
Teaching Line Plots with Whole Numbers
Start with Real-Life Contexts
Help students see that line plots are everywhere!
Begin with real data from your classroom — like the number of pets, pages read, or goals scored in a game.
Once you’ve collected the data, guide students to place Xs above each number on a number line.
This hands-on approach helps them visualize frequency and distribution while making the activity meaningful.
Model and Guide
Walk through examples as a class.
Model how to read questions like:
- “How many students scored more than 3 goals?”
- “What is the total number of goals recorded?”
Let students discuss what they observe — this builds both math vocabulary and reasoning skills.
Independent Practice Ideas
Once students understand the concept, they’re ready for independent or small-group work.
This is where differentiated resources can make a huge difference.
You can use:
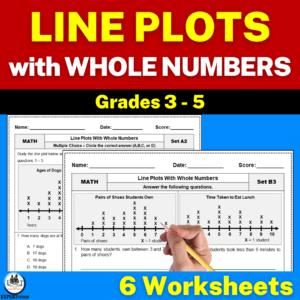
- Line Plot Worksheets with Whole Numbers – for focused practice and quick assessments.
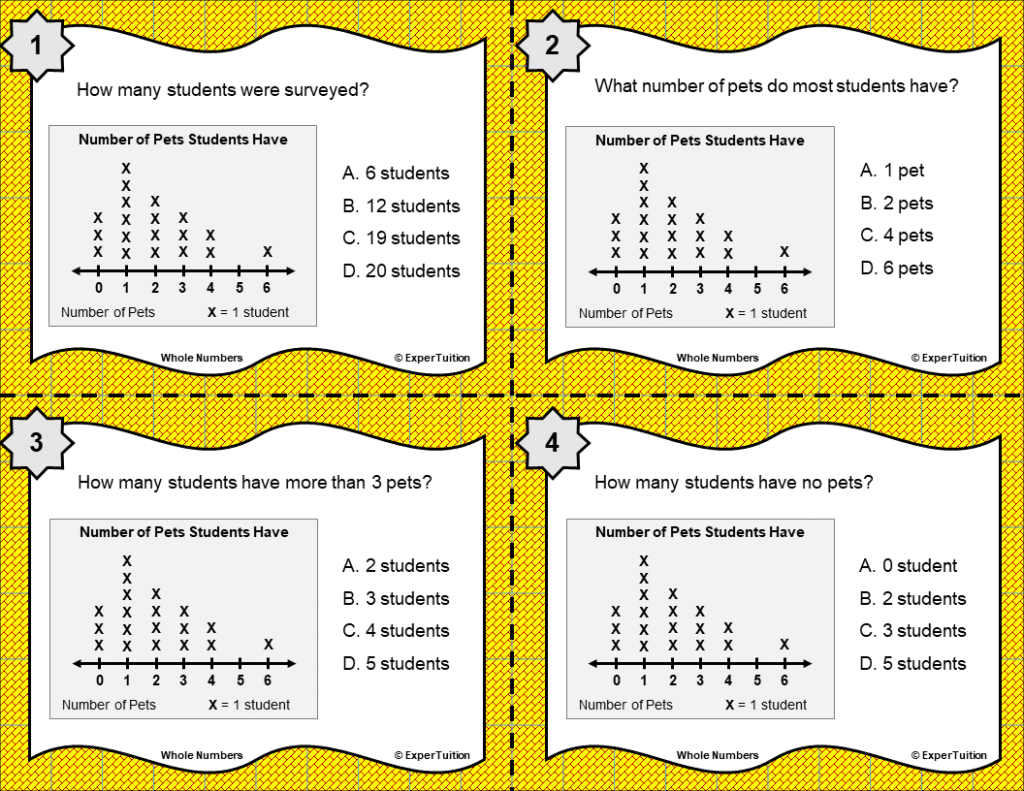
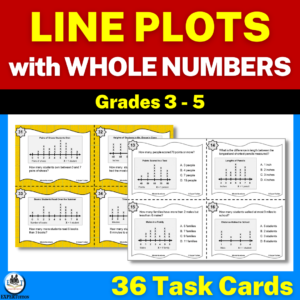
- Line Plot Task Cards with Whole Numbers – for math centers, early finishers, or partner games.
The multiple-choice sets give structured support, while the open-ended questions let students show their reasoning and explain their thinking.
-
 $ 3.25
 -
$ 3.25
Teaching Line Plots with Fractions
Introduce Fractions on Number Lines
Fractions take line plots to the next level.
Before plotting fractional data, review how to place fractions on a number line — for example, marking 0, ¼, ½, ¾, and 1.
Then, relate this to measurement activities, like:
- Measuring pencil lengths to the nearest ¼ inch.
- Recording liquid volumes in cups or liters.
Build Conceptual Understanding
Have students create their own fraction line plots from real or simulated data.
Ask them questions like:
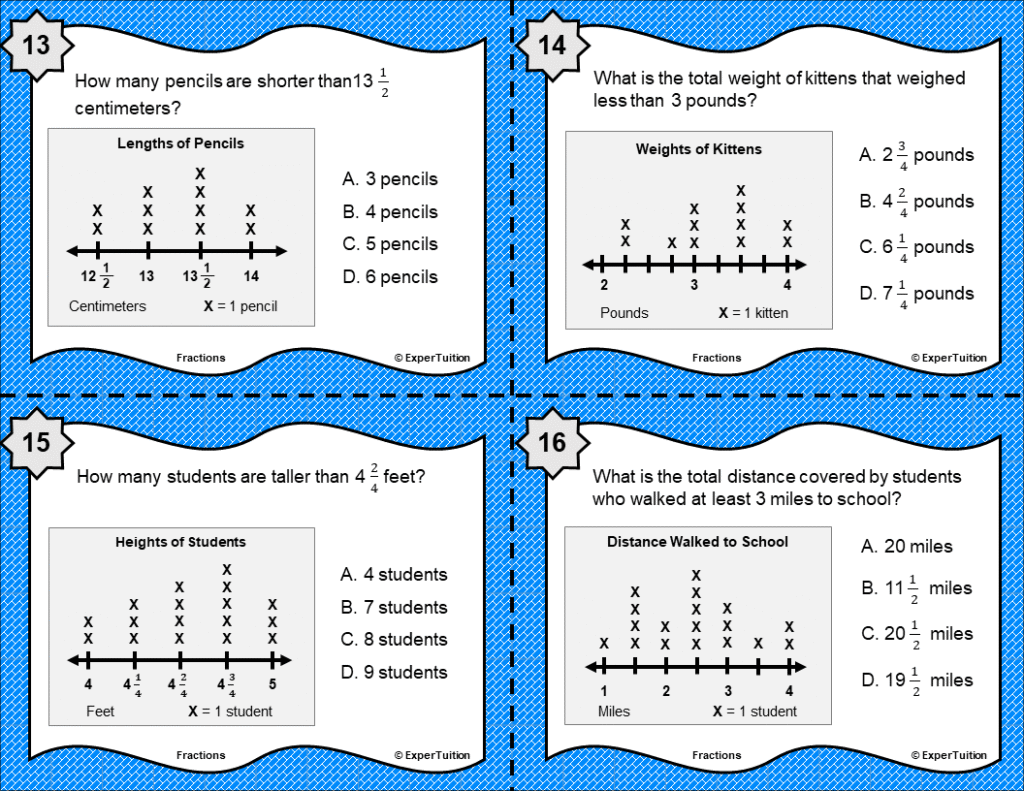
- “How many pencils were longer than ¾ inch?”
- “What’s the difference between the longest and shortest pencils?”
This not only reinforces fractions but also introduces data interpretation and reasoning.
Hands-On Fraction Practice
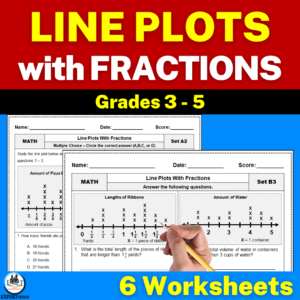
Once students are confident, let them practice with line plot worksheets and task cards featuring fractions.
The multiple-choice format offers guided support, while open-ended questions encourage deeper understanding.
They’re great for:
- Morning work
- Math centers
- Small group reviews
- Homework or exit tickets
-
$ 3.25
-
$ 3.25
Comparing Line Plots: Whole Numbers vs. Fractions
Students quickly notice that the process stays the same — they’re still organizing data and counting frequencies.
What changes is the type of data.
Encourage students to compare both:
- Whole-number line plots (simpler, discrete data)
- Fraction line plots (more complex, continuous data)
Transitioning between the two helps deepen their understanding of the number line and prepares them for more advanced graphing concepts.
Engaging Classroom Activities
Keep your lessons fresh with fun, real-world data projects:
- Classroom Survey: Collect data on favorite fruits, hobbies, or recess activities and plot the results.
- Measurement Madness: Measure classroom items to the nearest inch or fraction and plot them.
- Mystery Plot Challenge: Give students a line plot and have them create a story or data set to match it.
These activities promote collaboration and critical thinking while reinforcing math in context.
Common Mistakes and How to Fix Them
Even confident students can stumble on line plots.
Watch for these common issues:
- Miscounting X-marks
- Skipping numbers on the line
- Confusing fractions or spacing
- Mixing up line plots with bar graphs
Teacher Tip: Use color-coding, number line visuals, and guided discussions to help correct these errors early on.
Differentiate and Assess with Ease
Differentiation is key to mastering line plots.
Provide scaffolded practice for struggling learners and challenging word problems for advanced students.
Use data trackers and answer keys to monitor progress and simplify grading.
When students can both read and create line plots confidently, they’ve built a solid foundation in data interpretation.
Final Thoughts
Teaching line plots, whether with whole numbers or fractions, helps students connect math to everyday life.
By visualizing data, identifying patterns, and interpreting information, they strengthen both their analytical and numerical thinking.
With consistent practice and a mix of guided, independent, and hands-on activities, your students will master this concept in no time!
SAVE WITH BUNDLES (20% – 25% OFF)
-
Product on saleOriginal price was: $ 6.50.$ 5.20Current price is: $ 5.20.
-
Product on saleOriginal price was: $ 6.50.$ 5.20Current price is: $ 5.20.
-
Product on saleOriginal price was: $ 13.00.$ 9.76Current price is: $ 9.76.